Variances arrive explained
Not “revenue missed by $418K,” but which deals slipped, what win rate did, and where expansion landed. Drivers, not just accounting lines.
Management reporting
Reports, narratives, and decks draft themselves from the same live context your forecast runs on. Every number carries its source. Finance reviews, edits, and publishes.
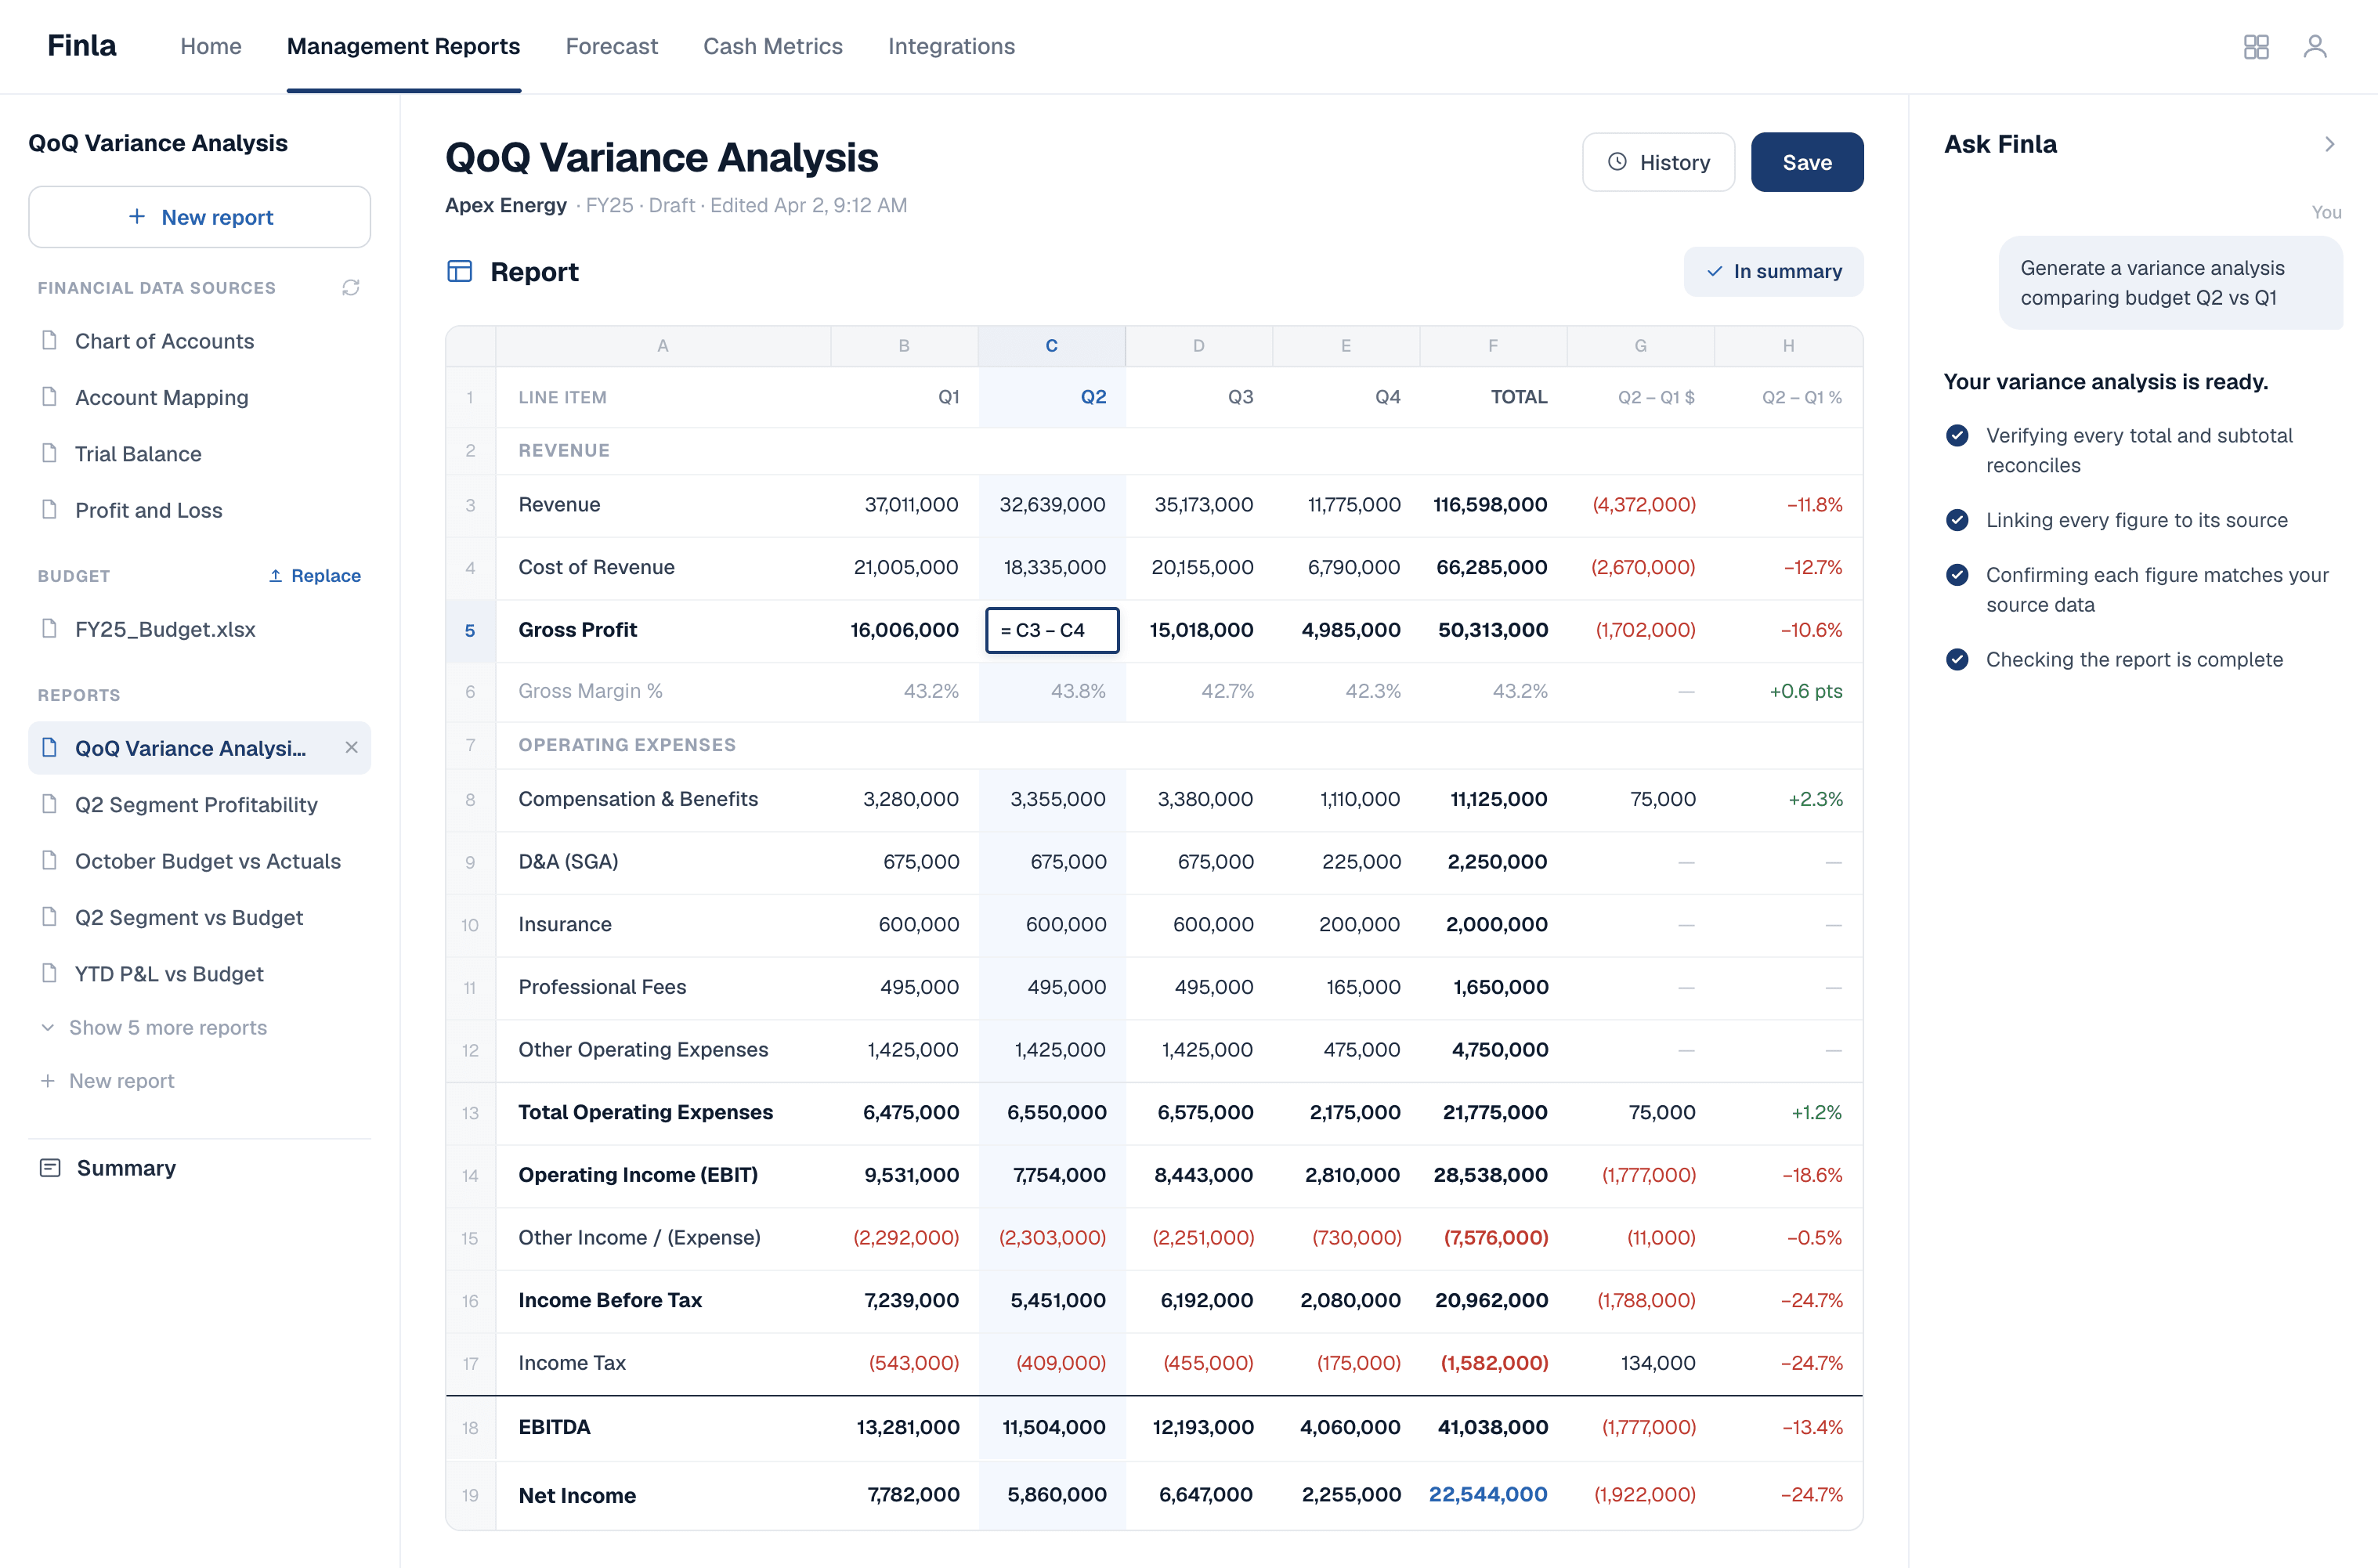
From close to deck
Not “revenue missed by $418K,” but which deals slipped, what win rate did, and where expansion landed. Drivers, not just accounting lines.
Every sentence in the draft traces to the statement cell or driver behind it. Reviewers check claims in place instead of re-deriving them.
The same reviewed context becomes the management report, the PowerPoint deck, and the answer to a Teams question. No re-stitching.
Trust every sentence
Drafts are grounded in your statements and drivers, and they show it. Click any claim to trace it to the cell it came from. Nothing publishes until finance approves. Review is the design, not a disclaimer.
Revenue came in at $5.4M, $418K below forecast P&L · Mar, driven primarily by two enterprise deals slipping to Q2 Pipeline (−$310K).
Win rate softened to 24% CRM · Q1, accounting for a further −$74K. Runway holds at 18 months Cash.
One context, every output
The same reviewed context leaves Finla in whichever shape leadership reads it.
Management report
Statements, variance tables, and cited commentary in one reviewed package.
PowerPoint deck
Board-ready slides exported from the approved report, charts and commentary included.
Teams answer
Leadership asks in Teams; finance answers from the same current context, with approval.
Bring one reporting cycle to a demo. We'll show the report, the narrative, and the deck drafted from your own numbers.